I have been having some good fun using the Open Log Artemis to develop a measurement tool kit.
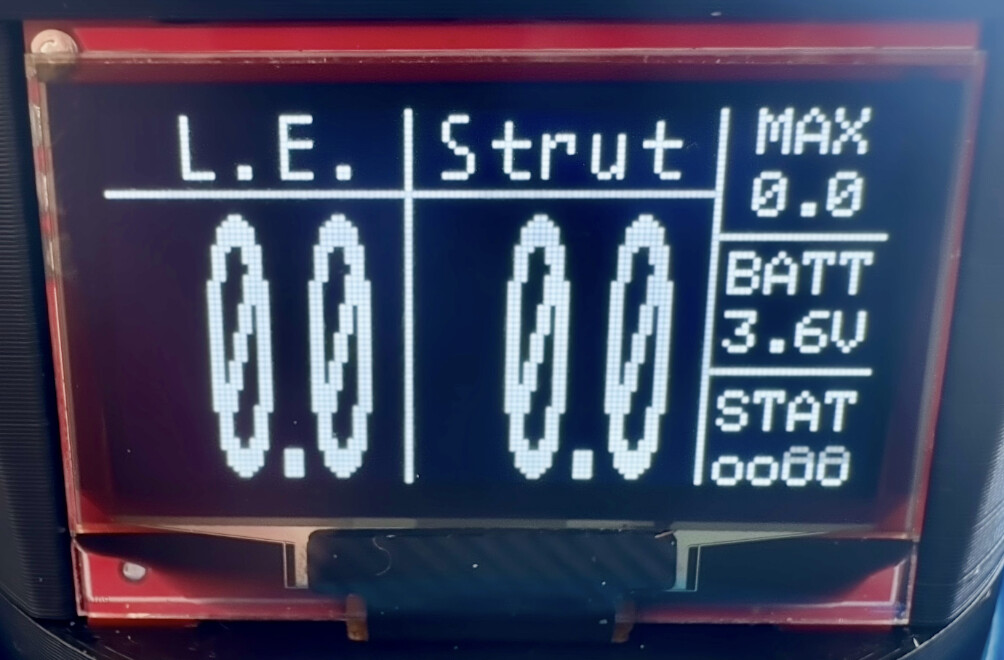
I was honestly a little bit surprised to learn that there was no native support for any of the qwiic displays. Rather than accepting defeat, I bought an OLED and decided to spend some time learning how to add a Sparkfun qwiic OLED as a read out for 2 of the data fields I was logging (in this case; two pressure sensors and then also the battery voltage, because I had available space).
2 Questions:
I am NOT a software engineer, and I am pretty sure I would be burned at the stake for how I implemented this. What should have been the right way to add this to the current OLA software architecture? (ill share how I did it later, but wanted to ask open ended first)
where should the data be “scraped from” in the code base? is there somepleace easy where the values are freely available to just send to a display update routine?
where is the safest place to add in/call a display update routine that wont interfere with the primary function of data logging
If I took a stab at doing this right, is this a feature that would be welcome in the code base? I think I would accomplish this by:
Adding detection and support for Sparkfun qwiic OLED (0.91 in) (including the alternate i2c adderss), likley with the OLED update set to be VERY slow (500 ms).
Adding a qwiic menu that allows you to select a single data field to display
Display that data field as large as possible centred on the display.
I have found this VERY helpful just to know that my sensors are working, the data is feeding through as expected and that when I pull out the microSD card at the end of the day, the content will meet expectations
We won’t be adding OLED support to the OLA firmware. There is no neat one-size-fits-all solution. Thinking about the number of characters required for each field: temperature could be squeezed into 2 or 3 characters, but something like GNSS latitude and longitude would need more like 10. For pressure, you’re probably looking at 4, but it depends on the units and resolution. This affects the choice of font size and where each field can be displayed.
Me, personally, I would go with a simple console-like scrolling text display using the smallest font. It would end up looking like the display on the GNSSDO. But I’m old school and I like that kind of display. This product I think may win the prize for squeezing the smallest text onto a small display.
A more contemporary approach would be to use widgets. The OLA sensor menu could be adapted so that individual sensor readings could be assigned to a widget, with a text size and position. Or maybe speedometer graphics would be more appropriate?
If what you have is working for you, then excellent! All we would encourage you to do is to share your modified code openly in a public repo, so we can all benefit. If AI generated that code for you, then wow. Exciting times…!
AI assisted if you will . . . . i definitely leveraged it to help figure out how to do some of it but don’t think it could have done it without the right coaching.
Fair point on the differences in the data and complexities that it would bring. I will clean up my code a little bit and get it into a public repo.
what would the proper method for getting data available for a display in this architecture?
I ended up modifying the DoSerialPrint() routine in OpenLog_Artemis.ino to parse out the fields I was interested in and store them as floats that could be passed to an oledUpdate() routine. Is there a better place or method to do this?
void DoSerialPrint(char (*funct)(const char *), const char *string, bool newLine)

{

  //-=-=-=-= Todd: I have modified this section to first parse values

  //for the OLED display and should be considered for deletion if there is any issue with

  //data capture rate.  EVERY cycle this data is captured even if not needed.  This is not

  //a problem when running slow, but is a potential issue as sample rates grow faster than

  //20-30 hz.  Please review the original released code to retrun "DoSerialPrint" to its

  //original capabilities.

char ch;


  // --- Make a modifiable copy of the input string ---

char buffer[128]; // adjust size if your CSV lines are longer

strncpy(buffer, string, sizeof(buffer) - 1);

buffer[sizeof(buffer) - 1] = '\0'; // ensure null-termination


// --- Parse fields with strtok_r ---

char *token;

char *rest = buffer;

int fieldIndex = 0;

while ((token = strtok_r(rest, ",", &rest))) {

if (fieldIndex == 2) {       // 3rd field (field position minus 1)

      vBatt = atof(token); // battery voltage

}

if (fieldIndex == 6) {       // 5th field (field position minus 1)

      pressure1 = atof(token) * 0.0145f - 14.7f; // hPa → PSI, Offset for sea level atmosphere

if (pressure1>pressureMax){pressureMax=pressure1;} // If new max pressure, overwrite

}

else if (fieldIndex == 8) {  // 7th field

      pressure2 = atof(token) * 0.0145f - 14.7f;   // hPa → PSI, Offset for sea level atmosphere

if (pressure2>pressureMax){pressureMax=pressure2;} // If new max pressure, overwrite

break; // all required values parsed, break

}

    fieldIndex++;

}


// --- Pass through characters as before ---

while ((ch = funct(string++))) {

Serial.print(ch);

if (settings.useTxRxPinsForTerminal) {

Serial1.print(ch);

}

}


if (newLine) {

Serial.println();

if (settings.useTxRxPinsForTerminal) {

Serial1.print("\r");

}

}

}
If it were me, I would do the data extraction in getData. I would be tempted to add a new setting in struct_LPS28DFW called displayPressure or similar. If the node has displayPressure set true, then the pressure is also added to the first available ‘widget’ (OLED position). Or it gets added to a vector (linked list) of float and you have separate code which steps through the vector and allocates each value to a widget / OLED position. Remember that the code needs to work if you have multiple LPS28DFW attached.