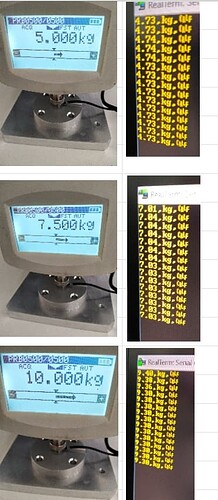
Hi. I have a question, is it possible to calibrate a load cell like Senstech KZ0-11-0400-80N-E1-K1-G0, using Openscale, with several values (not only Taring and 1 value). I have been using Realterm software, for calibration so far. I can set a precise load using a station equipped with a certified Axis FB200 force meter. I have noticed that when the load changes, after calibration, Openscale shows an increasing deviation. Returning to the value for which calibration was performed, the reading is precise. I know that there are companies that calibrate for several values. Is it possible to record the load for several values ?
Hi. I have a question, is it possible to calibrate a load cell like Senstech KZ0-11-0400-80N-E1-K1-G0, using Openscale, with several values (not only Taring and 1 value). I have been using Realterm software, for calibration so far. I can set a precise load using a station equipped with a certified Axis FB200 force meter. I have noticed that when the load changes, after calibration, Openscale shows an increasing deviation. Returning to the value for which calibration was performed, the reading is precise. I know that there are companies that calibrate for several values. Is it possible to record the load for several values ?
I think you’re describing linearity. The cell repeats for arbitrary loads but isn’t proportional across the load range. Normal calibration adjustment first captures zero force/empty signal value, then the signal value associated with the known load applied. The electronics/instrumentation assume a straight line relationship between them. Recall the point slope formula: y=mx+b where b is that captured zero point and m is based on the rise-over-run relationship over the two loads.
The entire objective of a load cell it to allow the load-flex to be in a straight line. However, as you know, materials bend (deflect in the lab) in curves so that weird geometry associated with load cells and similar measuring devices (proving rings, force gauges, dynamometers) is, in part, an attempt to allow the flexing to occur in a linear fashion. It’s also to permit more bending within the load range: if the cell was rigid, it couldn’t work. You can find the ideal load cell in the drawer with the frictionless pulley and the neglect-air-resistance cannonballs.
We see that the nonlinearity is a mechanical problem. You can take two approaches: improve the mechanics to get better values or use electronic tricks to help account for the existing errors. The first is distantly preferred: replace a faulty cell, shim the mounts for flatness, stabilize the loading surface and environment, reevaluate the fixturing, etc. The second is accommodating the errors with multipoint linearity calibration in the instrumentation. A lot of commercial scale indicators have this built in but there’s no reason you couldn’t perform your own curve formula calcs.
Of course, there’s always a limit. Can you put some numbers on your loads and outputs?
Thank you for your answer. The mechanical problem is eliminated, [since the calibration station is designed to maintain a constant pressure (which we are able to observe over time - we see the invariance), changes are visible only after changing the load. Returning to the calibrated value gives the correct reading. The reading without load is also correct. The deviation is visible on various strain gauges, I am posting the measurement for the FORSENTEK 10C strain gauge. It was tared without load and calibrated with a load of 1 kg. You mention some tricks, can you provide some details? (maybe links). As I understand it, multi-point calibration is not possible on Openscale? You mention some commercial scale indicators, can you recommend something?
Yes, this is the telltale characteristic of a nonlinear response. It is correct at two values but incorrect at all others. For load cells, the first correct value is zero/no load and the other is your span calibration point. If you adjusted your span at 2 kilograms instead of 1, you’ll likely find it repeats at 2 kg but is goofed up at 1 and all others. You’re riding up and down a curve instead of a line. A two point calibration adjustment alters the angle but doesn’t flatten the curve.
If you’re uncertain whether the problem is in your electronics, simply measure the load cell output on the signal wire pairs. This output in millivolts is ultimately used by the instrumentation to correlate to load (kgf) so measuring directly here eliminates the possibility that something strange/malfunction is happening in the electronics. And that’s possible, a really weird preexisting linearization value or failing component could do any number of unpredictable things.
(Please see edit below)
BUT, thanks to your neat photos, it’s clear to me that something is mechanically messed up in your load cell or mounting. In particular, something is bottoming out between 5 & 7.5 kg. Those button cells are really only good at being small but need room to deflect and are very sensitive to off center loading.
EDIT:
I didn’t realize your photos were thumbnails and misread the data! In short, I thought the bottom photo had values of 7.3 for 10kg applied, not 9.3. It’s not nearly as bad as I thought and I’m really sorry for my mistake.
There’s still some linearity error but I’ll bet if you adjust span near 4-6 kg half capacity or more, the values will come out better. The compromises inherent in a button cell are still there. You may try some things like rotating the cell so the cable comes off at, say, 6 o’clock instead of 3 to validate your fixtures and loading apparatus.


